Memory · garbage collection · profiling
Make JVM memory and runtime behavior observable
Memory, garbage collection and profiling inside the Java runtime. Follow a guided path from first principles to the behavior that matters in production.
Choose a path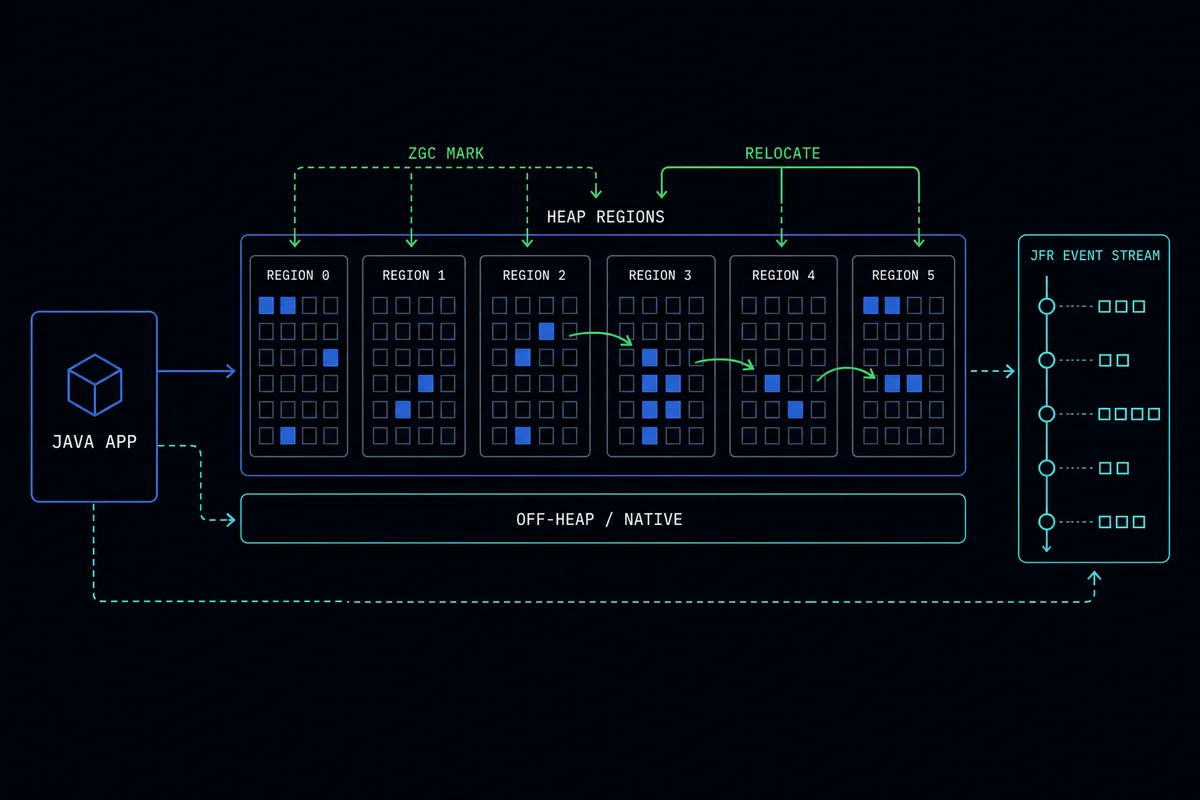
01 / Pick where to begin
Choose a learning path
3 guides across 3 paths01 / JFR · events · profiling
Observe the runtime
0 of 1 runs complete02 / Heap · off-heap · allocation
Memory systems
0 of 1 runs complete03 / ZGC · pauses · concurrency
Collectors
0 of 1 runs completeAbout this collection
The JVM hides a great deal of machinery behind ordinary Java code. Objects move through managed memory, garbage collectors coordinate concurrent work and native allocations can grow outside the heap that most dashboards emphasize. When latency or memory use changes, the useful question is not simply whether the JVM is slow. It is which runtime mechanism changed, what evidence would reveal it and how that mechanism affects the application.
This collection provides a compact path through those internals. Start with Java Flight Recorder to see how low-overhead events become evidence, then examine off-heap memory and ZGC in detail. The guides connect runtime structures to the symptoms engineers actually investigate: allocation pressure, pauses, retained native memory and misleading top-line metrics. They are useful when preparing a profiling plan, interpreting production telemetry or building a mental model before reading JVM implementation documentation. Each guide focuses on observable transitions instead of presenting tuning flags as universal answers.